Analyzing the Media’s Take on Coronavirus and the 2020 Election
Just a year ago at this time, while the Democrats were competing for their party’s 2020 nomination, many people believed that the economy’s strength throughout President Donald Trump’s first term would likely lead to his reelection. In March, that belief evaporated quickly, as COVID 19 began spreading across the country, leading to lockdowns and spikes in unemployment. The pandemic was an unprecedented shock, particularly during an election year compared to the 1918 Spanish flu, making it difficult to assess what the impact of the coronavirus was. Even after the election, it’s impossible to know whether or not Joe Biden still would have won if not for the pandemic and the economic downturn it caused. Yet despite all of the negative impacts of the coronavirus, Yahoo News had the headline, “The Political Coronavirus Paradox: Where the Virus Was Worst, Voters Supported Trump the Most.” Traditionally, incumbents are punished for tragic events that occur on their watch, so this media narrative seems to directly contradict that.
In order to consider this narrative, we should first note that COVID 19 is an extremey complex and difficult issue to assess, and that coming up with a definitive answer about its impact on the 2020 election is impossible. However, if we do want to get some insight into the veracity of this narrative, we first have to decide what the criteria are for the virus being “worst.” If we go by total deaths or total cases, we would see the heavily Democratic states California and New York near the top of the list, especially since New York was hit early on before adequate PPE and masks were available and when doctors did not yet know how to treat patients with COVID 19. Further, California and New York are two of the most populated states in the country, so it makes sense that they have had more cases and deaths. Instead, it makes more sense to look at rates of infection normalized by population. Below, we have a picture taken from the site https://www.statista.com/statistics/1109004/coronavirus-covid19-cases-rate-us-americans-by-state/, which shows the top 14 highest infection rates per capita in the United States as of December 9th, 2020:

While ideally it would have been better to look at the results per capita on or prior to election day, that information is hard to find at this point; however, cases have been rising steadily across the country in nearly every state, making it unlikely that the ordering of the states in the above picture would be drastically different than it was on November 3rd. Among the 14 states listed above, we see that 10 of them did indeed go Republican, while only 4 of them (Wisconsin, Minnesota, Illinios, and Rhode Island) went Democratic in 2020.
The graph above appears to indicate that Donald Trump did indeed do better in places with high rates of COVID 19. However, there were certainly some states like Rhode Island, Minnesota, and New Mexico with very high infection rates which Joe Biden won by significant margins. Further, while the graph indicates a correlation, that does not imply causation. In particular, Donald Trump’s suggestions to avoid wearing masks are likely to be predominantly followed among his strongest supporters, who comprise a large percentage of the population of states like North Dakota. Lack of mask wearing only increases the spread of the coronavirus, so this trend appears to be the result of the partisan divide on mask wearing rather than voters rewarding Donald Trump for the impact of COVID 19.
Thus, while the raw numbers show a disproportionate number of the states with the highest infection rates going Republican, we should not conclude that it is in the incumbent President’s political interest to have a global pandemic occur during their first term. Rather, this appears to be a fluke associated with mask wearing and unusually partisan responses towards an event that typically would not cause such a stark partisan breakdown. Thus, while this media narrative appears to be verified by the data, we should not generalize from it in assessing future shocks during presidential election forecasting.
Post Election Reflection
In my model, I predicted 48 states correctly, missing Florida and North Carolina. In my prediction, I believed that both of these states, along with Pennsylvania, Arizona, and Georgia were going to be the closest swing states.
Both Florida and North Carolina were coin flips according to my regressions. I put North Carolina as blue because Cal Cunningham was expected to defeat Republican incumbent Senator Thom Tillis. However, despite Joe Biden winning the presidency, Democrats performed quite poorly in congressional races, and North Carolina was no exception. Also, once my regression predicted that Georgia would probably go blue, I felt that it was impossible to imagine an electoral map with a blue Georgia and a red Florida and North Carolina. Florida went blue as recently as 2012, and North Carolina as recently as 2008. Even when Republicans won both states, the races were far narrower than in Georgia. As it turned out, Georgia ended up going blue by a slim margin, while Donald Trump held onto Florida and North Carolina.
Broadly, the polls seemed to indicate that a blue tsunami was coming all across the country, similar to Barack Obama’s in 2008. Instead, we got the following swing map:

We see that in general most states were more blue than in 2016, with the notable exception of Hillary Clinton’s home state of New York, but not to nearly the same degree as we saw in 2008. Among the swing states, only Florida became more red than in 2016. Below, we see a bar chart comparing the difference between the predicted Democratic two party vote and the actual two party vote for 2020:

In general, this model overestimated Joe Biden’s winning margin in 9 of the 10 swing states. But in 6 of the 10 swing states, the margin of error was less than 2%, making this a reasonably accurate model. The largest errors in the model were in Wisconsin, Iowa, Michigan, and Florida, where they overestimated Joe Biden’s winning margin by anywhere from 2.31% to 4.43%. One reason for this could be that Wisconsin, Iowa, Michigan were historically more blue, with a notable exception in 2016. For this reason, the data points reflecting Bill Clinton or Barack Obama’s successes in these states likely inflated the expectations of Joe Biden in 2020. However, the electoral map and the demographics within states change over time, and some of these data points may be too outdated to yield an accurate model. On the other hand, in historically red states like Arizona and Georgia, Joe Biden was leading in the polls but the model predicted a very close race because of how well Republicans traditionally did in these states. The polls overall were systematically biased towards Joe Biden, so it makes sense that the model did better in states that were historically red than in states which were historically more blue.
In order to test whether this was a source of error in my model, I could try giving more weight to more recent elections in the swing states, and seeing how the predictions change. Intuitively, for Iowa, even though the model predicted a near 50-50 split, I was confident that it would go red just because Donald Trump won it by more than 10 points in 2016. Quantifying that intuition and applying it to all of the swing states could perhaps yield more accurate results across the board. One possibility would be to give each election year one-half the weight of the previous one, so 2016 gets 50%, 2012 gets 25%, 2008 gets 12.5%, and so on, cutting it off maybe around either 2000 or 1992. Going further back would incorporate outliers like Ronald Reagan winning 49 states in 1984, which is certainly not reflective of today’s electoral map.
If I were to do this again, in additon to the weighting scheme above, I likely would also incorporate historical trends, in the spirit of the swing map above and the other swing maps from week 1. An Obama style blue wave is very rare, so even though the polls overwhelmingly favored Joe Biden, he ended up winning by a clear but not overwhelming margin both in the popular vote and in the electoral college. Meanwhile, the reddening trends in places like Florida or Iowa are important to consider. Overall, placing more weight on actual concrete previous voting outcomes and less on polls which can potentially have serious, systematic biases would likely make both the predicted margins and outcomes much more accurate.
Final Election Prediction
Question: Who will win in 2020?
Prediction: Joe Biden will win the 2020 election with an electoral college breakdown of 351-187 and a two party popular vote breakdown of about 54%-46%.
Over the past several weeks, we have considered a variety of factors to try to predict the outcome of the 2020 election, including the economy, polls, demographics, COVID 19, and more. Of these, polls have had the highest correlations and the best out of sample predictability when testing them on predicting the 2016 election. For this reason, we use polls to make our final prediction for 2020.
We begin with the popular vote. Similarly to week 4, we graph below the polling averages vs national popular vote historically for incumbents, except now we look at 4-10 days before the election:

According to 538, over the past week Donald Trump has been polling nationally at approximately 43%. The above model, which has correlation 0.959, has equation y = 0.932x + 5.49. Plugging in 43% gives Donald Trump’s predicted popular vote 0.932(43) + 5.49 = 45.56%. If we test this model on 2012 by using out of sample predicting, we predict that Barack Obama would have received 47.4(0.8604) + 7.8 = 48.64%, while he actually got 50.9%, so it is within a couple of percent of the correct answer.
Now we switch to the electoral college. As mentioned in previous blog posts, the ten swing states to watch this year are Arizona, Florida, Georgia, Iowa, Michigan, North Carolina, Ohio, Pennsylvania, Texas, and Wisconsin. It is worth noting that Donald Trump won all of these in 2016. This model assumes that Joe Biden will not lose any of the states that Hillary Clinton won.
For these swing states, we construct regression models between the average polling margin ten to four days before the election and the actual historical margin (Republican two party vote - Democratic two party vote). We then look at what the averages are in 2020 and what we predict.
If we test this model on these ten states in 2016, we predict the outcome correctly in Arizona, Georgia, Ohio, and Texas. It predicts tossups in Florida, Iowa, North Carolina while predicting Pennsylvania, Michigan, and Wisconsin. While this is not a great performance, in general 2016 underestimated the uneducated white male voter turnout, and pollsters this year are weighting by education more: https://www.washingtonpost.com/politics/2020/10/29/how-2020-polling-works/. Thus, we stick with this model and use it to predict 2020. That said, this model is primarily based on polls and does not directly account for a myriad of other factors including COVID 19, the economy, unprecedented voter turnout and more, so we cannot be certain that any of the predicted outcomes below will actually occur.
Nevertheless, if we construct these models, it appears that Michigan and Wisconsin are safely in Joe Biden’s grasp, while Texas and Ohio will likely go Republican. While this model predicts that Iowa will be an extremely close race, Donald Trump’s overwhelming victory there in 2016 suggests that he will carry the state in 2020. Meanwhile, Arizona, Florida, Georgia, North Carolina, and Pennsylvania remain quite narrow, although Joe Biden has slight leads in all of them.
To try to figure out what will happen here, we go beyond the regressions and look at the actual data. Arizona has voted Republican every year since 1952 except for Bill Clinton’s victory there in 1996, where he was polling at approximately 46% at this point in the election cycle. Joe Biden is the only Democrat in recent history to poll over 50%, and exceeds Bill Clinton’s polling margins by several percentage points. This suggests that Arizona will flip this year. We can visually see by the picture below that the margins are a good predictor, and indeed the correlation is approximately 0.91:

We can also look at the Senate races for each of these swing states, since these can also give an idea as to which way the state will vote. According to 538, the Democratic candidate is expected to win in Arizona, Michigan, North Carolina, and Wisconsin. The Republican candidate is expected to win in Iowa, Ohio, and Texas. In Georgia, a Democratic is expected to win one seat while a Republican is expected to win the other, and there are no senators up for election in Florida or Pennsylvania.
For these reasons, we forecast Arizona and North Carolina as going blue. Florida is a coin flip, but we will predict it will go blue on the basis that Florida generally votes for the winner and that Mike Bloomberg has spent 100 million dollars there in support of Joe Biden. In Georgia, the correlation between the poll margins and the actual vote margins is 0.98, and we can see this visually below:

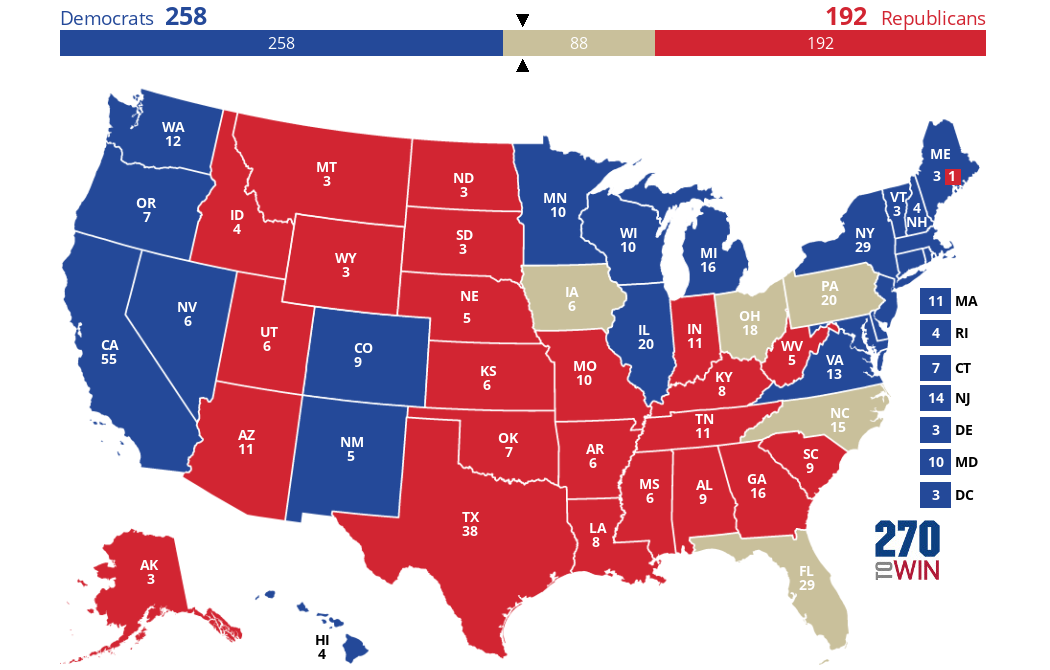
Thus, we predict that Joe Biden will win Arizona, Florida, Georgia, Michigan, North Carolina, Pennsylvania, and Wisconsin and that Donald Trump will win Iowa, Ohio, and Texas. This is summarized in the electoral map below, constructed using www.270towin.com:

 Click the map to create your own at
 One thing worth noting is that if Joe Biden holds onto every state that Hillary Clinton won, and flips Michigan, Wisconsin, and the second district in Nebraska, that puts him at 259 electoral votes. This means that he only has to win one of Arizona, Florida, Georgia, North Carolina, and Pennsylvania in order to win. Of course, elections are unpredictable, and Donald Trump could surprise the world again with a victory on Tuesday. But overall, it is likely that Joe Biden will win in 2020.
The Effect of COVID 19 on Donald Trump’s Reelection Chances
Question: How have deaths due to COVID 19 impacted Donald Trump’s polling numbers throughout 2020?
Prediction: In some of the key swing states, Donald Trump’s polling numbers have decreased slightly when measured against deaths due to COVID 19, but this has not been a universal trend, and the correlations are not particularly high. Further, there is no recent precedent for a global pandemic of this scale during an election year. While Joe Biden’s lead did begin to increase around March or April when the virus began to spread within the United States, this is also when Joe Biden became the nominee, so he began to receive all of Democratic support and enthusiasm at that time. Overall, the impact of COVID 19 does not appear to be clear, so we stick with last week’s prediction that Joe Biden is favored to win in 2020.
While many unusual events have occurred in 2020, from the largest conversations on race since the 1960s and a race to confirm a Supreme Court justice in the narrowest window ever before an election, the most jarring event this year has undoubtedly been COVID 19, which at this point has become a backdrop for all of these other issues. In a matter of weeks, nearly all gatherings became virtual or were cancelled, while unemployment skyrocketed. Predictions based on the improbability of replacing an incumbent president during a booming economy vanished, and all other issues nationwide became secondary as countless lives were lost.
More recently, Donald Trump himself tested positive for COVID 19. He has touted his successful recovery as indicative of Americans being able to survive this virus, while Joe Biden has expressed that he wishes everyone had healthcare coverage in case they get sick. At both presidential debates, as well as the vice presidential debate, COVID 19 has remained a key topic, and it likely will be on many undecided voters’ minds as they decide whom they believe will manage the health crisis better.
Here, we look at the relationship between deaths over time in key swing states and Donald Trump’s polling numbers in those states. In Arizona and Florida, we see negative trends, although they are very slight:


However, in Texas, we actually see a slightly positive trend:

In each of these cases, the correlations are fairly low, and the R^2 values in each of these swing states indicate that COVID 19 deaths actually account for less than 10% of the overall variation in Donald Trump’s poll numbers. Combined with the fact that the trends vary from one swing state to the next, it appears that deaths due to COVID 19 are not actually a great predictor of Donald Trump’s poll numbers. Perhaps this can be attributed to the fact that polls vary wildly, or maybe people do not blame him for these deaths as much as people would predict. Despite this, COVID 19 remains a key issue in the 2020 election, and its impact on voters is made all the more mysterious by these observations. We stick with last week’s prediction based on demographics that Joe Biden will win in 2020.
Using Demographic Changes Over Time to Predict the 2020 Election
Question: How can we use shifting demographics in key swing states to predict the 2020 election?
Prediction: Based on how demographics have changed over time, we can predict that Joe Biden will win the 2020 election.
Demographics within a population can often give insight into how that population will vote. For example, it is well known that African Americans tend to vote Democrat, while senior citizens tend to vote Republican. Here, we look at the relationship between the demographics of each of the main swing states for 2020 based on race, gender, and age and see how well these factors predict the popular vote within that state.
As mentioned in previous blog posts, the ten main swing states in 2020 are Arizona, Florida, Georgia, Iowa, Michigan, North Carolina, Ohio, Pennsylvania, Texas, and Wisconsin. In the very first blog post, we saw that the south has been getting more blue over time while the midwest has been becoming more red. Here, we examine demographically why that might be happening and what it means for 2020. Rather than focus on all ten swing states, we focus our attention towards Arizona, Georgia, North Carolina, and Pennsylvania, since these are the states that have the highest correlations between the actual two party vote and certain demographics.
We only have access to demographic data through 2018 for each state, which is two years before this year’s election. To be consistent with this to best predict 2020, we create linear regressions between the popular vote in each state and shifting demographics two years earlier. We see the following for Arizona and Georgia:


To assess the accuracy of this model, we can use out of sample testing to try to predict 2016. In Georgia, if we omit the 2014 demographic data and the 2016 election results, we get the equation y = -10.26x + 541.42. Then, using the fact that in 2014 the population of Georgia was 48.17% male, we predict a Democratic two party vote of -10.26(48.17) + 541.42 = 47.20%, while the actual two party vote was 47.34%. This gives us confidence that even though our model is univariate, it still is accurate and we can use it to predict 2020.
Plugging in the 2018 male populations in Arizona and Georgia gives a predicted outcome that Joe Biden will receive -7.393(49.406) + 411.753 = 46.494% of the two party vote in Arizona and -10.28(48.06) + 542.42 = 48.3632% of the two party vote in Georgia.
We get the following model for Pennsylvania, where we look at the white population instead of the male population because the white population has a historically higher correlation with the two party vote in Pennsylvania:

Then, plugging in the 2018 white population in Pennsylvania, we predict that Joe Biden will receive 0.4702(78.744) + 13.198 = 50.224% of the two party vote, a very slim victory. These predictions, where Arizona and Georgia both go red but Biden is slightly favored in Pennsylvania, are consistent with the predictions from the polling week. Since we previously have predicted that Joe Biden will win in 2020, we can continue to believe that prediction will hold.
Using Binomial Regression Models and Polling to Predict 2020
Question: How can we use binomial regression to predict the outcome of the swing states?
Prediction: The binomial regression model predicts that Joe Biden will win nearly every swing state in 2020. Further, it gives him such a significant margin of victory that Donald Trump would not only have to exceed expectations, but blow them away significantly more than he did in 2016 to win reelection.
As noted two weeks ago, the ten main swing states this year are Pennsylvania, Florida, Michigan, Wisconsin, Georgia, Texas, Arizona, Iowa, North Carolina, and Ohio. In that blog post, where linear regression was used, the prediction was that Arizona, Texas, and Georgia would go Republican, while Wisconsin and Michigan would go Democrat. The closest states which were labeled as tossups were Pennsylvania, Florida, Iowa, North Carolina, and Ohio. Here, we focus on trying to narrow down what will happen in these states using binomial regression. Also noted in that blog post was the fact that the raw polls themselves do not necessarily reflect the actual vote margins in the state, and sometimes were wildly off. For this reason, we use the predicted numbers from those linear regressions as the probability of any individual voter within a state voting Democrat or Republican. To test the accuracy of this model, we check to see how well it does in predicting the swing states of 2016. An example for Florida is shown below:

In actuality, Hillary Clinton received 49.38% of the two party vote compared to Donald Trump’s 50.62%, or a loss of 1.24%. While this is relatively close to the values in the distribution above, we can note that the binomial regression predicts with near 100% probability that the difference would be between -1.85% and -1.75%, which is not accurate. This tells us that we should pay more attention the the binomial predicted mean than its predicted variability in outcomes.
Now we consider 2020. We get the following distributions for Ohio and North Carolina:


As mentioned above, one questionable attribute of this model is the extremely narrow variance that it predicts. While the binomial distribution is good for modeling repeated events, it does not account for the widespread unpredictability of presidential elections. For this reason, the binomial distribution does not give us too much information beyond the pointwise mean estimate that the linear regressions gave us two weeks ago. The distributions for Pennsylvania, Florida, and Iowa are similar, where the mean has Joe Biden up by 1 or 2 percentage points but the variance is much smaller than we would reasonably expect.
Realistically, this means that Joe Biden has a slightly better chance in each of these states, but more likely than not, some of them will go red and some will go blue. For example, with only a 51% lead in Iowa based on the regressions from two weeks ago, there is certainly unpredictability that Joe Biden could still lose this state and others. If we go purely by this model, we would get that Joe Biden would win about 346 electoral votes. Even accounting for the fact that some of these states will likely go red, Joe Biden still has a comfortable enough lead that we can still predict that he will win on November 3.
The Role of Incumbency in the 2020 Election
Question: Does incumbency help Donald Trump in 2020?
Prediction: There is no indication in either the data or the calamitous events of 2020 that incumbency helps Donald Trump. For this reason, last week’s prediction that Joe Biden will win in 2020 still stands.
Since World War II, incumbent presidents have won reelection in all but three cases. Despite this, there is reason to believe that 2020 will be different. For example, Joe Biden is currently leading by about 8 points nationally over incumbent President Donald Trump: https://projects.fivethirtyeight.com/polls/president-general/national/. Meanwhile on October 3, 2016, Hillary Clinton held only a 3.7% lead over then candidate Donald Trump: https://projects.fivethirtyeight.com/2016-election-forecast/national-polls/.
We can compare national polls taken between 32 and 36 days before the election and see how well they predict the popular vote for incumbent Presidents. This is shown in the graph below:

We see visually that there is a very high correlation between the incumbent President’s polling average and the actual popular vote, and this correlation turns out to be 0.966. To check that the model is not overfitted to the data, we can omit the 2012 election and see how well we predict it. We predict that Barack Obama would get about 0.8659(48.888) + 6.863 = 49.2% of the popular vote, and he actually got 50.9%, so the model is accurate within a couple of percentage points.
According to 538, the latest polls have Donald Trump around 43%. Plugging this into the regression, we get a predicted national popular vote share of about 44% for him. This would put Donald Trump very low on the graph above, near 1980 and 1992, which are two of the three years since World War II that the incumbent President has lost reelection. It also puts him below 1976, where Gerald Ford lost to Jimmy Carter.
At the end of last week, we predicted the following electoral map made using www.270towin.com based on the trends in polls by swing states compared to the actual vote in those swing states:
While Donald Trump famously lost the popular vote in 2016 but still won the electoral college, the map above indicates that his chances of doing so this year are much slimmer. This may be further exacerbated by his positive COVID 19 test and hospitalization, which may make people worry about his health going forward. Another possible reason is that voters tend to blame the incumbents for things not necessarily within their control. Although the government passed a lot of stimulus programs in order to help people financially who lost their jobs due to COVID 19, millions are still facing eviction. Many of these people may blame this on the federal government and especially Donald Trump, who is the face of the government, and therefore not support him in 2020. Combined with other major events this year including wildfires, hurricanes, and protests, voters may be ready for a change.
Whether we look at the numbers themselves or the many events that have happened in 2020, nothing indicates that Donald Trump benefits from being the incumbent candidate. As a result, the prediction from last week that Joe Biden will win the presidency still stands.
Using State Polls to Build a 2020 Electoral Map Prediction
September 26th, 2020
Question: How can we use previous election years’ polling data by state in comparison with the actual vote by state to predict this year’s electoral map based on current 2020 state polling data?
Prediction: Joe Biden appears to be favored, but he does not have a “guaranteed” blue firewall. It is likely that he will win Michigan and Wisconsin, while Donald Trump will likely win Arizona, Texas, and Georgia. Then, North Carolina, Florida, Pennsylvania, Iowa, and Ohio remain the key deciders. They all appear to be leaning blue but only by a slim margin. If Joe Biden wins even one of these states, and holds on to every state Hillary Clinton won in 2016, then he will surpass 270 electoral votes. On the other hand, Donald Trump must win all five of these states in order to be reelected. It is worth noting that all of the polls analyzed below were taken prior to Ruth Bader Ginsburg’s death, and it is unknown how the Supreme Court battle will change the polls in the coming weeks.
Based on observations in popular vote trends by state from week 1, as well as common knowledge about the most competitive states in 2020, the swing states this year are likely Florida, Georgia, Pennsylvania, North Carolina, Arizona, Wisconsin, Michigan, Texas, Ohio, and Iowa. The other 40 states are likely to vote the same way they did in 2016. To make more informed predictions for each swing state, we look at how accurately the polls between six to nine weeks before the election are at making predictions. The results are somewhat surprising. Even within a state, the Democratic poll averages might be almost completely uncorrelated with the two party vote while the Republican poll averages may be highly correlated, and vice versa. Some states, like Texas, have extremely high correlations between the poll averages at this point in time and the actual two party vote in the state:

On the other hand, Pennsylvania is very unpredictable: the two party vote in Pennsylvania always comes around to just around 50-50 regardless of the polling averages as we can see below:

The Republican poll averages in Pennsylvania are similarly uncorrelated with the actual two party vote. While Pennsylvania did vote blue every year since 1992, the Democratic margin of victory was always very slim, which suggests that it was wrong to consider Pennsylvania as part of Hillary Clinton’s “blue wall” in 2016. It also suggests that regardless of Joe Biden’s current lead in the polls, Pennsylvania remains a near tossup.
By looking at all of the correlations and regressions for each swing state, we can conclude that the most reliable Republican polls for 2020 are likely in Arizona and Texas, while the most reliable Democratic ones are in North Carolina, Iowa, and Wisconsin. Meanwhile, the Democratic polls in Florida and Michigan and the Republican polls in Georgia are somewhat reliable.
We can use these linear regression models between the average poll six to nine weeks before the election and the actual two party vote in each of the states to help predict 2020. To assess the accuracy of these models, we use out of sample testing by first making the regressions based on data through the 2012 election and seeing how well we can predict 2016. This can help check that the model is not overfitted to the historical data and is still good for predicting future elections. If we omit 2016 from the data and run these regressions, we predict Arizona, Florida, Georgia, and Texas all within 1% of the actual vote. The errors are a bit larger in North Carolina, Ohio, and Iowa, but the model still correctly predicts that Donald Trump should win these states as he did. The model does predict that Pennsylvania, Wisconsin, and Michigan would all go for Hillary Clinton and of course they very famously did not, but our observations above explain that Pennsylvania should never be trusted. The actual two party Democratic vote in Wisconsin and Michigan was right below the 50% mark, and the model slightly favors Clinton.
Despite this, the errors are small enough that we can apply this same model to 2020, albeit with a bit of caution. We can also note that the pollsters themselves are adjusting to expect a higher uneducated, white male voter turnout than they did in 2016, so there is reason to believe that the 2020 polls will be more accurate, especially in places like Wisconsin and Michigan. If we run the regressions and plug in the 2020 polling data, we get that Arizona, Texas, and Georgia are likely going Republican by about 53%, while Wisconsin and Michigan are likely going Democratic by about 54%. Meanwhile, Florida, North Carolina, Ohio, and Iowa are all around the 51% mark, and Pennsylvania is likely a tossup. This is summarized in the following electoral map, made using the website www.270towin.com:
With such slim margins, it is not safe to call Florida, Pennsylvania, Ohio, Iowa, or North Carolina one way or another. However, Joe Biden only needs one of these states to win (or two if Iowa is one of them), whereas Donald Trump must win all four states besides Iowa. Combined with Joe Biden’s slight leads in these states, he remains the clear favorite in 2020, but his victory is definitely not guaranteed.
Effects of Economic Variables on the National Popular Vote
September 19th, 2020
Question: Is the effect of the economy stronger for sitting presidents running for re-election compared to same-party heirs seeking the office? Does the predictive power of economy change across time? If so, why?
Prediction for 2020: Although the economy appears to have a stronger effect for sitting presidents compared to the incumbent party candidates, this year the economy is wildly different relative to previous years due to COVID 19. For this reason, factors which normally correlate with the incumbent’s popular vote are not reliable predictors in 2020. For this reason, my prediction for this week remains the same as last week.
We examine the relationship between the national popular vote in presidential elections for an incumbent President versus an incumbent party candidate relative to two economic factors: real disposable income and the unemployment rate in the second quarter, as this is fresh in voters’ minds when they cast their ballots in November. Each of these factors impacts different groups of people in different ways. We note that many people will always vote Democrat or Republican based on their views on issues such as healthcare, abortion, religion, and more. These people comprise the majority of voters in very liberal states like California and Massachusetts or very conservative states like West Virginia or Oklahoma. However, for undecided voters, the predominant question is which candidate is more likely to improve their lives the most. Especially as COVID 19 has led many people to lose their jobs, many voters will be looking to choose the candidate whom they believe will get them back on their feet and save them from getting evicted.
We begin by looking at the relationship between second quarter RDI Growth and the incumbent president’s national popular vote:

We get is a correlation between RDI_growth in the second quarter and the popular vote of the incumbent candidate of approximately 0.746. The best fit line above is given by the equation y = 500.68x + 48.33. Since the second quarter RDI growth of 2020 was 0.097%, this model would predict that Donald Trump would win 500.68(0.09724) + 48.33 = 97.01% of the vote! Obviously, this is absurd and no electoral predictions for this election are remotely close to this. The issue here is that the RDI_growth in the second quarter of 2020 was fairly high at 0.097% as the government passed the PPP and stimulus checks in order to help businesses continue to pay their workers as they shut down due to COVID 19.
We also get a visible relationship between second quarter RDI_growth and the incumbent party candidate’s national popular vote:

This graph includes both the sitting presidents running for reelection as well as incumbent party candidates. Here, while we do see a general positive trend, we only get a correlation of 0.507. This indicates that voters do not associate the current growth in rdi with the political party in the White House as much as they associate it with the President himself. Further, part of the trend we see in this graph is influenced by the previously observed trend with sitting presidents.
Now we look at the relationship between second quarter unemployment rate and the national popular vote of sitting presidents:

We see that unemployment in the second quarter actually has very low correlation, about -0.16, with the popular vote of the incumbent. Perhaps this is because the majority of voters in any given election are not going to be unemployed, so whether the unemployment rate is 4% or 6% does not seem to be a good indicator of whether the incumbent will win reelection. With regards to the 2020 election, many have speculated that the economic downturn will lead many voters to blame Donald Trump and vote for Joe Biden. However, this is not backed up by historical data and suggests that voters do not generally associate the unemployment rate with the current President. In 2020 especially, many voters are likely to blame the pandemic as opposed to the government if they got laid off due to the lockdown. For this reason, Joe Biden’s best strategy in this regard is to actively blame Donald Trump for allowing COVID 19 to become this widespread for this long. Otherwise, the historical data indicates that Donald Trump will not be as damaged by the rise in unemployment as the media have speculated.
If instead we look at the incumbent party rather than just an incumbent President, the correlation vanishes entirely:

Visually, we can see that there is no relationship between these two variables, and the correlation is about 0.0067. Similar to our observations with RDI growth, this also suggests that voters do not make an association between the previous president’s party and the incumbent party candidate.
From these models, it does not appear that the predictive power of the economy has changed significantly over time, since the data from 50 years ago or more appears to be distributed similarly to the data in more recent elections. Rather, it suggests that single variables such as RDI growth or the unemployment rate appear to be too contrived to accurately reflect voters’ opinions for the next presidential election, especially when a sitting president is not running for reelection. For this reason, it is difficult to extrapolate from this data in any meaningful way to predict the outcome of the 2020 election, particularly with the unprecedented impact of COVID 19 this year. In order to accurately predict the 2020 election, other variables outside of the economy should be considered.
Swing States in the Past and in 2020
September 12th, 2020
Question: Which states are/have been swing states? Which are no longer swing states?
Prediction: In the 2020 election, based solely on trends in the popular vote within each state, the swing states will likely include Wisconsin, Minnesota, Michigan, Pennsylvania, Florida, Arizona, Georgia, and Texas.
These states are expected to be close in the 2020 election, and whoever wins the majority of them will almost certainly be the next President of the United States. Here, we look at how the swing states have changed over time. To do this, we only consider the two party vote for each state, and we compute the difference between the Democratic proportion of the two party vote in year y and in year y-4. A positive number with large magnitude indicates a Democratic shift, while a a negative number with large magnitude indicates a Republican shift. While we typically think of swing states as having extremely close elections, under this model we are actually looking for larger differences between two consecutive presidential elections in order to see which states swing significantly from one election to the next.
We see a large blue wave from 2004 to 2008 across the country:

Then, from 2008 to 2012, things mostly stayed the same, with some light red shifts throughout the country:

Finally, from 2012 to 2016, we see the midwest shift red while some southern states shift blue:

We see that Utah is the darkest red state from 2008 to 2012 and the darkest blue state from 2012 to 2016. However, this is likely due to Mitt Romney’s popularity in his home state and is not indicative of Utah swinging broadly from one election to the next in general.
There are a number of interesting trends that we can note from these swing maps. For example, we see that from 2008 to 2012 and from 2012 to 2016 that Missouri has gotten progressively redder. In 2008, John McCain narrowly beat Barack Obama in Missouri with a slim margin of 0.135% of the two party vote. A former swing state, Missouri now appears to be safely in Republican hands.
We can also see that several reliably blue states are trending towards being much more swingy. For example, Democrats have won Minnesota in every election since 1976, including in 1984 when Ronald Reagan won every other state (although it is worth noting that his opponent Walter Mondale was from Minnesota, which enabled him to escape with a 0.182% majority of the two party vote). However, we see that from 2008 to 2012 and from 2012 to 2016, Minnesota has swerved much closer to the center.
Michigan, Pennsylvania, and Wisconsin show similar trends. After voting blue in every election since 1992 (and 1988 in the case of Wisconsin), these three states flipped in 2016. If we look at the maps, we see that all three states have been getting redder since 2008.
On the other hand, some reliably red states are also moving towards the center, including Arizona, Georgia, and Texas. Since the end of George W Bush’s second term, Texas has been moving closer to the center, most notably from 2004 to 2008 and 2012 to 2016. Georgia follows a similar pattern. From 2008 to 2012 they each leaned slightly Republican compared to the previous election, but the trend is towards the center. Arizona has also been shifting blue in more recent elections.
From these trends, it appears that the midwest is turning red, while the south is getting more blue. As these regions approach the center from opposite directions, it is likely that these are the states which will decide the outcome of the elections in 2020 and the near future.